Reports
Below the main chart, every breakdown is grouped into five cards: Traffic Sources, Page Insights, Tech Insights, Geo Analytics, Custom Analytics. The first four sit in a two-column grid, Custom Analytics spans the full width below. Each card has its own tabs for individual reports. All respect the active date range and filters.
Click a row to drill down. Statable adds the value as a filter and refreshes the dashboard. Click Details in the top-right of a report to open the full table in a side panel with search, sorting, and infinite-scroll pagination.
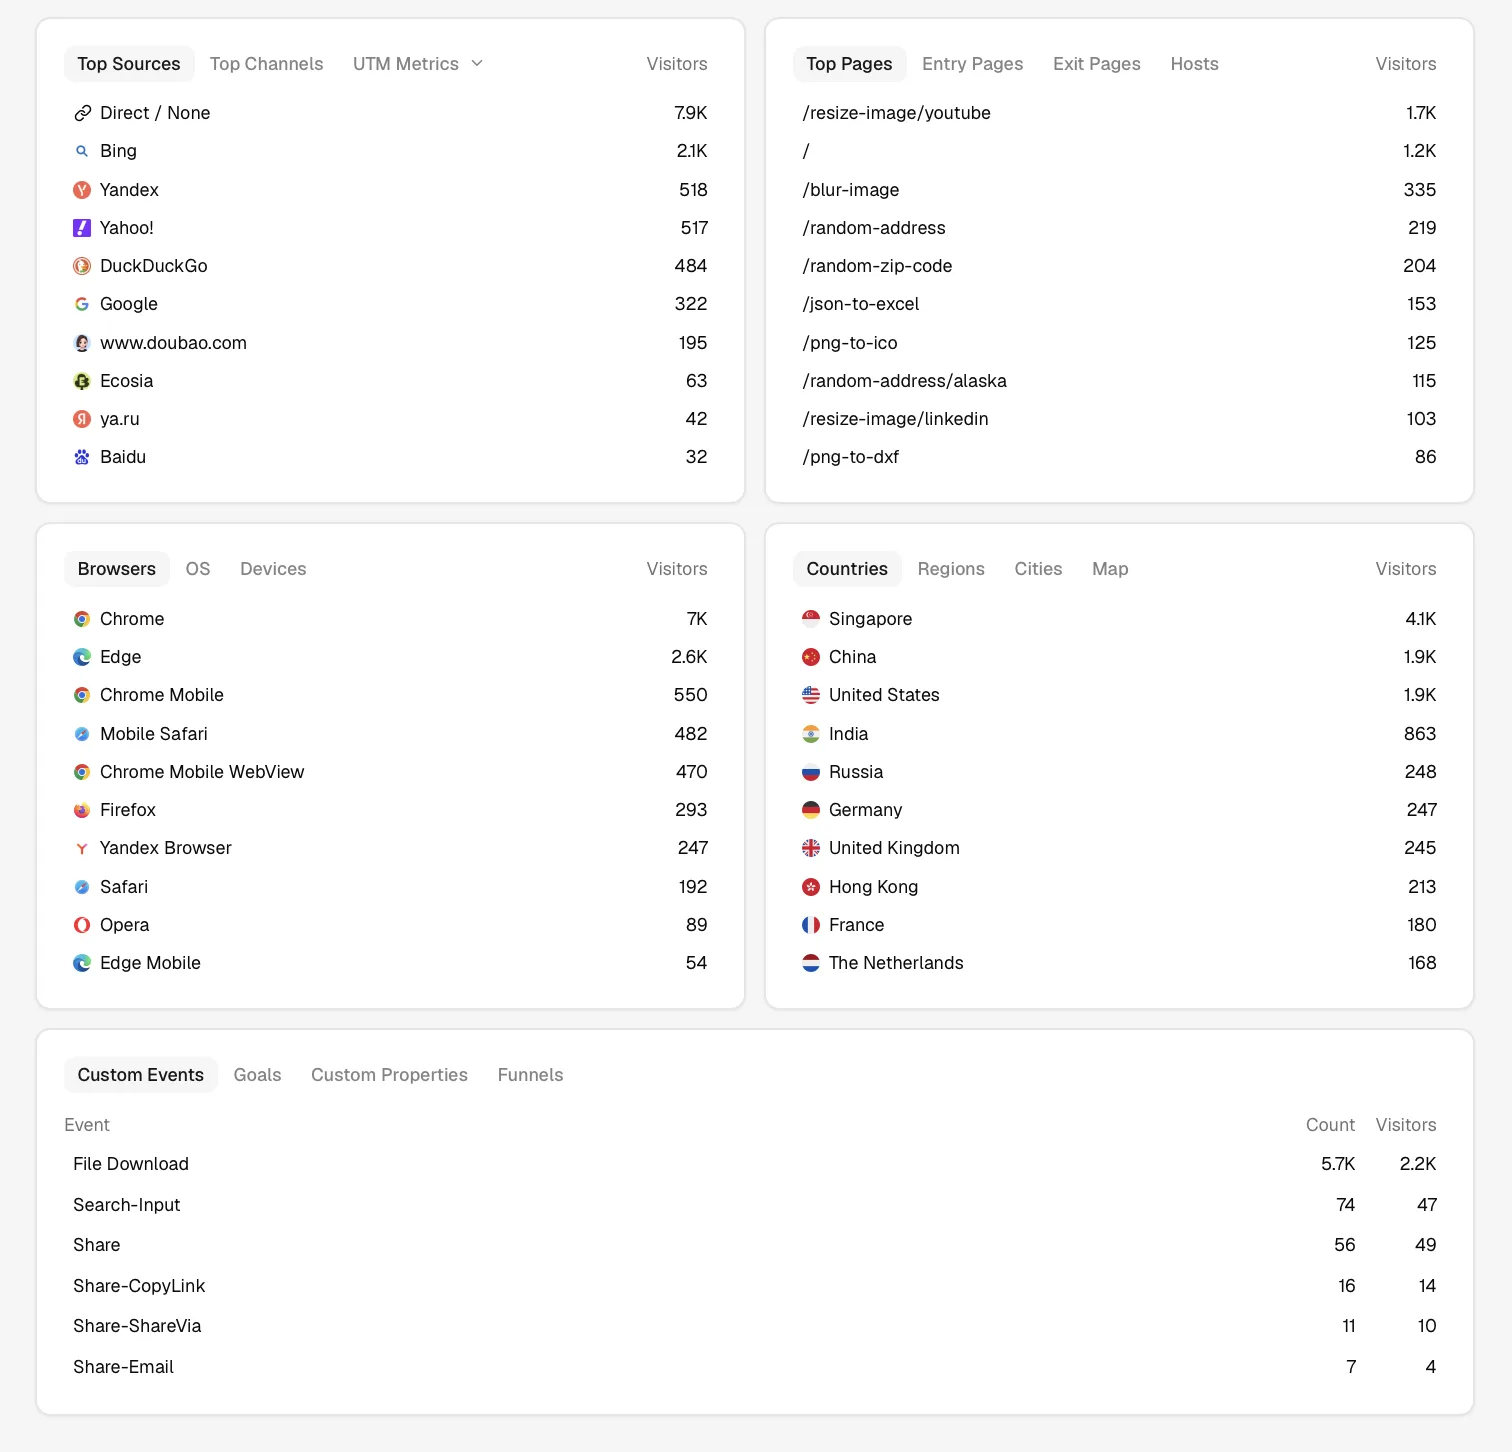
Page Insights
How visitors move through your URLs.
- Top Pages: pageviews, visitors, and bounce rate per path. The default for most sites. Answers "what content is working".
- Entry Pages: the first page of each session. Shows what brings people in from search and social.
- Exit Pages: the last page of each session. High exit rates on conversion paths usually point to friction.
- Hosts: splits traffic by hostname. Useful when one site serves several subdomains, and where a hostname you don't recognise will show up.
- Errors: HTTP status codes (
404,410,500), with a visitor count for each code. The code arrives with the pageview, and the tracking code reads it from a<meta name="status:code">tag on the page, so an error template without the tag or without the tracking code on it leaves no row. Only appears when a code has been recorded. Only codes 400 and above are listed. Error pages still appear in Top Pages like any other page.
For the difference between bounce rate and exit rate, see Exit Rate.
Traffic Sources
Where your visitors come from.
- Sources: the referring host (
google.com,x.com). When a visit has no referrer but carries autm_source, that tag is shown as the source instead, so a link tagged in a newsletter or an assistant's app does not read as direct. - Channels: Sources rolled up into marketing activity. Nineteen of them, the same set Google Analytics 4 uses, assigned at ingest from the referring domain and your UTM tags with nothing to configure. Direct, Organic Search, Paid Search, Organic Social, Paid Social, Email, Referral, Display and Affiliates are all there, alongside AI Assistant for visits from an assistant. Full list and the rules behind it: Traffic channels.
- Referrers: referring URLs with their path, not just the host. Useful for spotting which articles or threads drive traffic. Query strings are dropped at ingest, so what you see is the page that linked to you rather than its tracking parameters. The tab appears once you filter by a source: click a row in Sources, and Referrers lists the pages on that site that linked to you.
- UTM Sources: values of
utm_source. - UTM Mediums: values of
utm_medium. - UTM Campaigns: values of
utm_campaign. - UTM Contents: values of
utm_content. - UTM Terms: values of
utm_term.
For UTM structure, see UTM Parameters.
Tech Insights
Devices and software in use.
- Browsers: Chrome, Safari, Firefox, Edge, and minor browsers. Useful for QA prioritisation.
- OS: Windows, macOS, iOS, Android, Linux, ChromeOS.
- Devices: Desktop / Mobile / Tablet, rendered as a horizontal proportion bar with a table beneath.
Mobile share is one of the fastest signals to watch after a redesign. A dip after launch usually means a regression on small screens.
Geo Analytics
Where in the world your visitors are.
- Countries: country totals with flag icons.
- Regions: state, province, or oblast under the active country (drill from a country row).
- Cities: city-level breakdown, derived from IP via a local IP-geolocation database (DB-IP). No personal location is stored.
- Map: a world map shaded by visitor density. Hover for a country tooltip, click to filter.
Geo data is approximate. Country and region are the levels worth acting on. City comes from the same IP lookup and is often wrong for mobile networks, VPNs and corporate connections, at any traffic volume.
Custom Analytics
Everything you've defined yourself.
- Custom Events: events triggered via
window.statable.t('event_name', { ... })ordata-statable-eventattributes.s.jsalso auto-tracks outbound link clicks and file downloads. - Goals: named conversions configured under Site settings → Goals. Each goal shows total completions, unique converters, and conversion rate (unique converters ÷ unique visitors for the period).
- Funnels: an ordered sequence of steps (pages, events, or goals) that shows how many visitors reach each step and where they drop off before converting. See Funnels.
- Custom Properties: any
prop_*field attached to events. Each row is a (property name, value) combination with its event count.
For the event payload format, see Event payload reference.
Drill-down vs Details
Two interactions, two outcomes:
- Click a row. Adds the value as a dashboard filter. Every other card and report updates. Best for "show me everything about Chrome users".
- Click Details. Opens the full report in a side panel with search, sortable columns, and infinite-scroll. Best for inspecting the long tail.
Drill-downs stack. Filter to Chrome, then click a country, and you've narrowed to Chrome users from Germany. Clear the filter chips at the top to back out.
Reading reports
Most tables show three columns: a label, the active metric (visitors or pageviews), and percentage of the active total. Details exposes the same data with search and full sorting via progressive loading.
Bulk export
Export is on the roadmap. For now, Details gives you the full table for any report.
Ready to take control of your web analytics? Try Statable free for 30 days. No credit card required, full feature access, built for GDPR. Start your free trial or view a live demo.